Adding observability to my homelab (and immediately finding problems)
“The greatest value of a picture is when it forces us to notice what we never expected to see.” — John W. Tukey
I’ve been slowly building out my homelab, which currently consists of a single Proxmox box running six application LXCs and a seventh for monitoring.
There’s Immich, AdGuard, Stirling PDF, a couple of file servers, a wiki, and the usual assortment of things that seemed like a good idea to self-host at the time.
The next obvious addition was observability.
I wanted somewhere I could see whether everything was alive, look at resource usage, search logs, and get notified when something broke. So I ended up with the fairly standard Grafana stack:
- Prometheus for metrics
- Loki for logs
- Grafana for dashboards
- Alertmanager for alerts
- Blackbox Exporter for HTTP checks
- Grafana Alloy for collecting logs
Getting everything running was pretty straightforward.
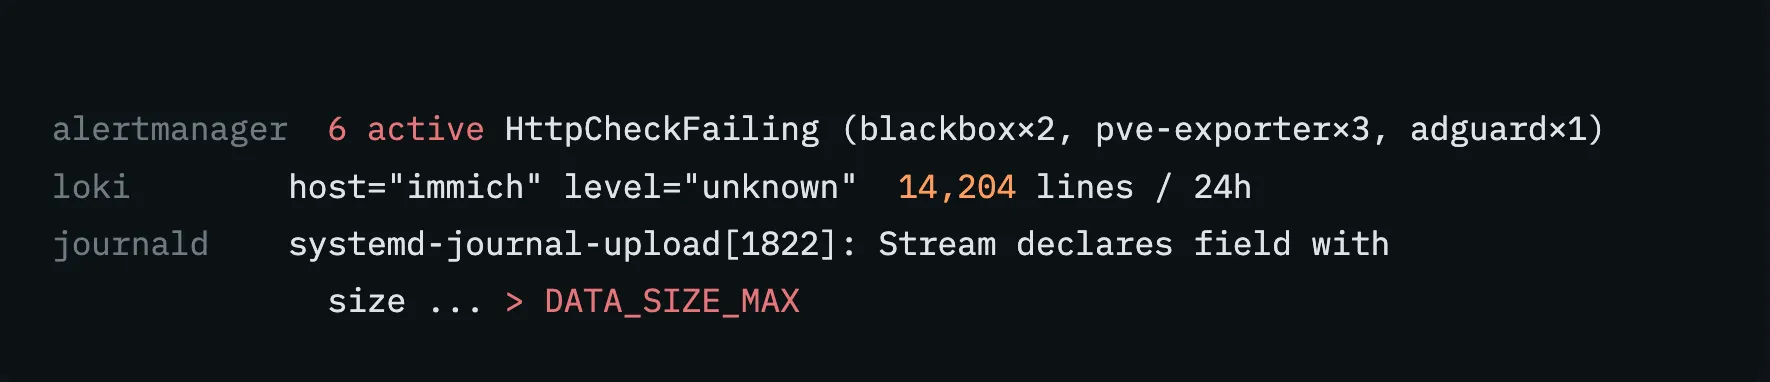
Within the first few days though, I had six alerts telling me perfectly healthy services were down, thousands of logs with an unknown log level, and a journald receiver repeatedly crashing.
So I ended up spending considerably more time debugging the monitoring stack than actually monitoring anything.
Here are three of the more interesting problems I ran into.
Docker didn’t know about my DNS
The first thing I noticed was that my shiny new uptime dashboard looked terrible.
Six HttpCheckFailing alerts were firing. Every *.home service appeared down, Proxmox metrics were missing, and the AdGuard dashboard wasn’t getting any DNS stats.
The services themselves were fine, so that narrowed things down quite a bit.
My homelab uses AdGuard for DNS, including local rewrites like:
photos.home (Immich)
monitoring.home (Grafana)
adguard.home (DNS)
The LXC containers themselves use Tailscale’s resolver at 100.100.100.100.
The problem was that the exporters were running one level deeper, inside Docker.
Tailscale’s DNS address exists on the LXC host’s tailscale0 interface, but isn’t reachable from inside the Docker network namespace. Docker therefore picked another resolver for the containers.
Unfortunately, it picked my LAN gateway.
My LAN gateway had absolutely no idea what photos.home was.
I checked /etc/resolv.conf inside the affected containers and found the same incorrect resolver in all three. What initially looked like several unrelated monitoring problems was really just one DNS problem.
The fix was not particularly exciting. For example, here’s the Blackbox Exporter change:
blackbox-exporter:
  image: prom/blackbox-exporter:v0.25.0
+ dns:
+   - 192.168.11.207
I explicitly pointed all three exporters at AdGuard.
On the next scrape, the alerts disappeared.
Why are all my logs unknown?
With uptime working, I moved on to logs.
Immich is a NestJS application, and its logs conveniently contain the log level:
[Nest] LOG [InstanceLoader] Immich dependencies initializedSo extracting LOG, WARN, ERROR, etc. should have been easy.
Except Grafana showed most of my logs as:
level="unknown"Looking at what Loki had actually stored made the problem fairly obvious:
\x1b[36m[Nest]\x1b[39m \x1b[32mLOG\x1b[39m [InstanceLoader] ...Colours!
NestJS was outputting ANSI colour escape sequences, and those bytes were being shipped all the way into Loki.
I already had an Alloy stage.replace configured to remove them, and according to the Alloy documentation it should have been operating on the log line by default.
Apparently it wasn’t.
Rather than continue tweaking the regex, I tried something much simpler.
I changed the stage to replace:
Nest → TESTMARKERThen searched Loki for TESTMARKER.
Nothing.
Meanwhile Nest continued happily arriving unchanged.
That was useful because it ruled out my ANSI regex entirely. The replacement stage simply wasn’t modifying the forwarded log line the way I expected it to.
Fortunately Alloy has stage.decolorize specifically for this:
- stage.replace {
-   expression = "\\x1b\\[[0-9;]*m"
-   replace    = ""
- }
+ stage.decolorize {}
After switching to stage.decolorize, the stored line became:
[Nest] LOG [InstanceLoader] Immich dependencies initializedand the level extraction started working.
This was probably my favourite bug of the three because the debugging technique was incredibly unsophisticated.
If you’re not sure whether a transformation is happening, replace something obvious with something stupid and see if it appears.
TESTMARKER has never let me down.
My elegant journald setup lasted about five minutes
The last problem came from the few LXCs where I don’t run Docker.
Copyparty, FileBrowser, and LeafWiki are just native services writing to journald.
I didn’t particularly want to install another daemon everywhere just to ship logs, and systemd already provides systemd-journal-remote and systemd-journal-upload.
Perfect.
One central receiver, tiny footprint, nothing else to maintain.
Then I turned it on.
systemd-journal-remote: Stream declares field with
size [large value omitted] > DATA_SIZE_MAX
The receiver immediately started crash-looping.
After digging through the package versions and upstream issues, I eventually traced it to how systemd-journal-remote handled chunked request bodies delivered by libmicrohttpd. The receiver treated each fragment as a complete compressed blob, rather than processing the request body incrementally (systemd issue #43614).
More importantly, it affected the package combination Debian trixie currently ships:
systemd 257.13
libmicrohttpd12t64 1.0.1-4
At this point I had a few options.
I could pull a newer libmicrohttpd from sid, but I couldn’t find any evidence that the bug was fixed there.
Or I could downgrade to the bookworm version, override the declared dependencies, and bring an older libgnutls30 along for the ride.
This was quickly becoming a lot of effort to preserve an architecture I’d chosen because it was supposed to be simple.
So I gave up.
Each LXC now runs Grafana Alloy directly as a small standalone binary and systemd service. Alloy reads the local journal and ships it straight to Loki.
LXC
├── application
├── journald
└── Alloy
      │
      └──► Loki
It’s technically more software running on each container than my original design, but it’s also much less weird.
I kept one rule from the original setup: nothing gets installed directly on the Proxmox host. The hypervisor stays clean and boring.
Interestingly, changing the architecture also uncovered a couple of smaller configuration problems that hadn’t been exercised yet. Loki needed compactor.delete_request_store configured when retention was enabled, and I’d completely forgotten to add a DNS rewrite for monitoring.home.
So fixing one problem revealed two more.
Very observability.
What I ended up with
After about six days of messing around, everything now looks roughly like this:
HTTP targets ──► Blackbox Exporter ─┐
PVE metrics ────────────────────────┼──► Prometheus ─┐
AdGuard metrics ────────────────────┘                │
                                                     ├──► Grafana
LXC journald ──┐                                     │
               ├──► Alloy ──► Loki ──────────────────┘
Docker logs ───┘

Prometheus ──► Alertmanager
Nothing here is particularly fancy. Most of the problems were small configuration or integration issues that happened to sit across Docker, DNS, systemd, Debian packages and Grafana’s tooling.
But that’s also what I’ve been enjoying about running a homelab.
At work, these layers might belong to several different teams. At home, if DNS is broken, congratulations: you’re the DNS team.
Six days after deciding it would be nice to have some graphs, I now have considerably more software, a better understanding of systemd-journal-remote than I ever wanted, and a monitoring system that has finally stopped generating incidents for itself.
For now.